What is the impact of various energy conservation measures on EUI?
Project Location: Zone 0A Extremely Hot Humid
Simulation Scale: Shoebox Model
Application: Real Project
Audience: Architect/Designer
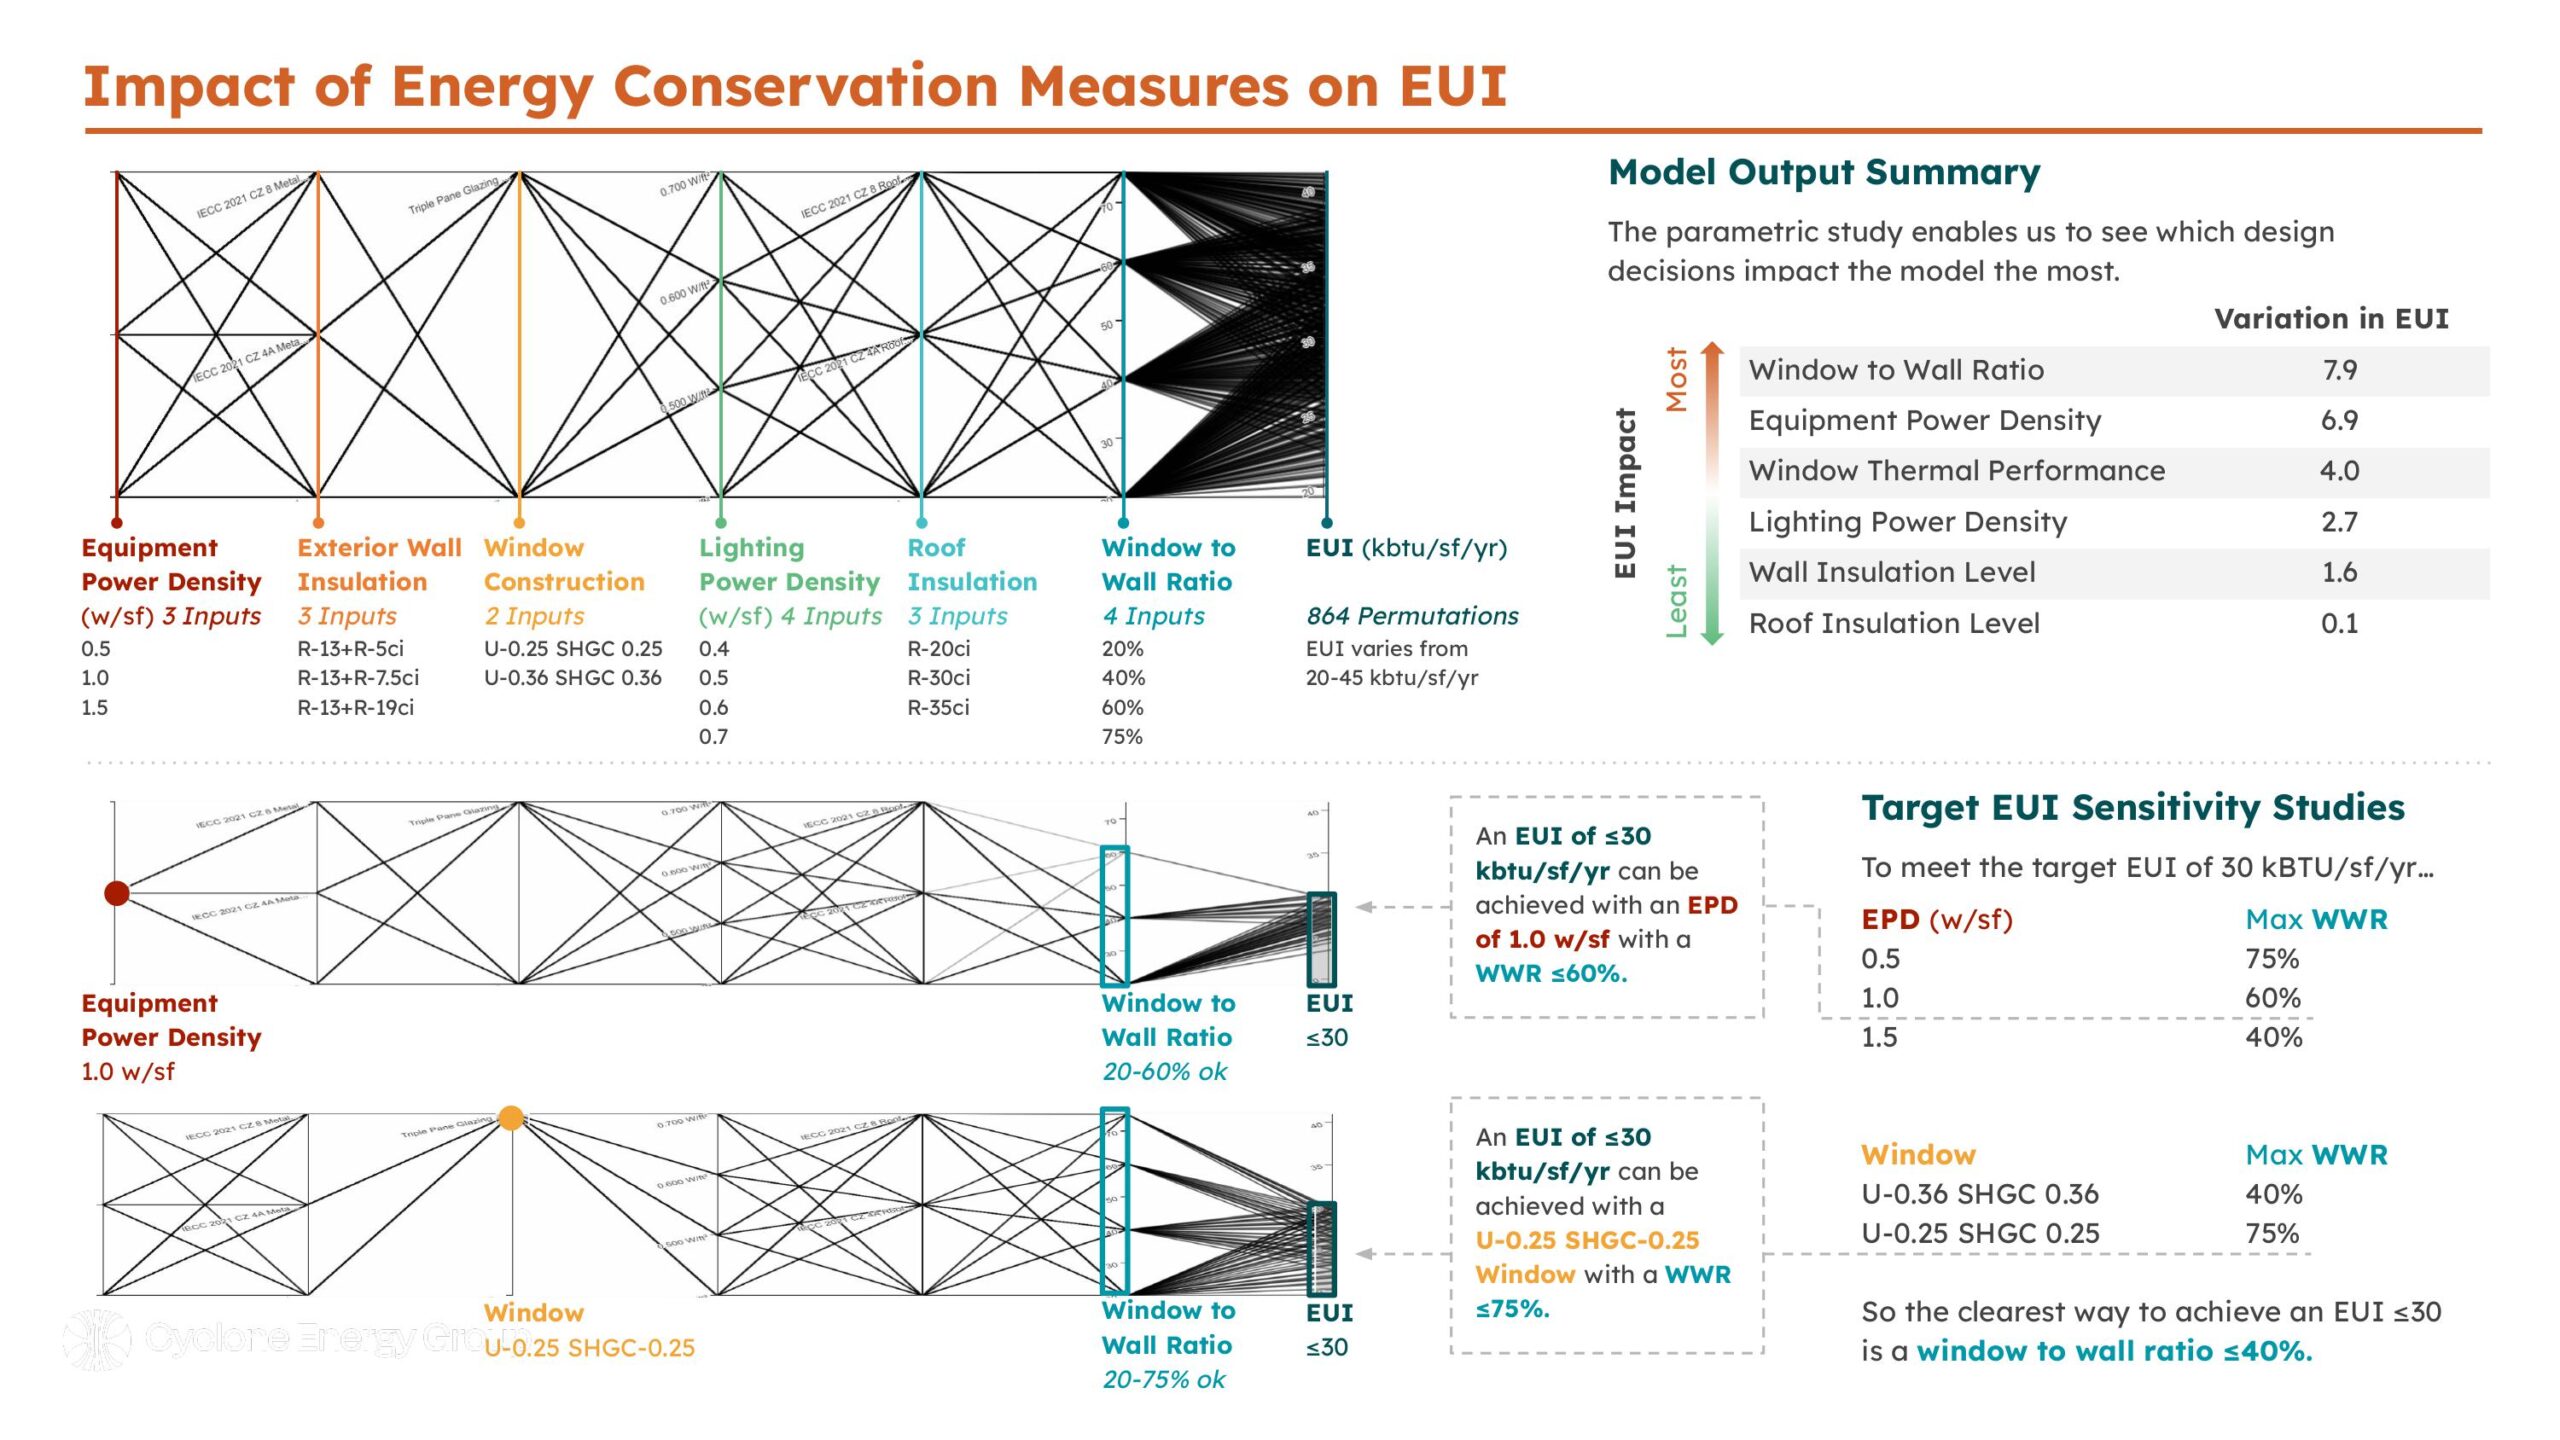
What is this graphic showing? Describe the different parts of the graphic and how it communicates the data.
This graphic demonstrates various ECMs that were tested out on an office building in CZ4A. The top graphic demonstrates all the ECMs combined and how they relate to EUI. The table to the right demonstrates which measures are the most impactful relative to their EUI impact. The bottom two left graphs demonstrate a specific scenario and its impact on the available EUI range.
What type of graphic is this?
- Parallel coordinates
Design Variables
- Glass U-value / SHGC
- Glazing Fraction/Window to Wall ratio
- Insulation R-value
- Other
What tools were used for the simulation analysis?
- Excel
- IES-VE
What tools did you use to create the graphic?
- Excel
- Other
What was successful and/or unique about the graphic in how it communicates information?
This graphic utilizes color and linear relationships to connect the dots between different parallel coordinates. It combines several different types of information to relay which ECMs are the most impactful relative to EUI and relative to eachother.
Is there anything else you would like to mention?
Additional credits and other contributors:
Allen Mei, Amir RezaeiIncluded in the competition:

2025 Annual Project StaSIO Challenge - Deadline May 27th, 2025
March 20, 2025-June 5, 2025