This year’s Annual StaSIO Competition was a success! We received more than 10 submissions, which were carefully reviewed by our impressive jury.
As a first, the upcoming 2026 Annual Competition will include all graphics submitted throughout the year cycle, so don’t hesitate to submit your favorite graphics now!
Overall Winner
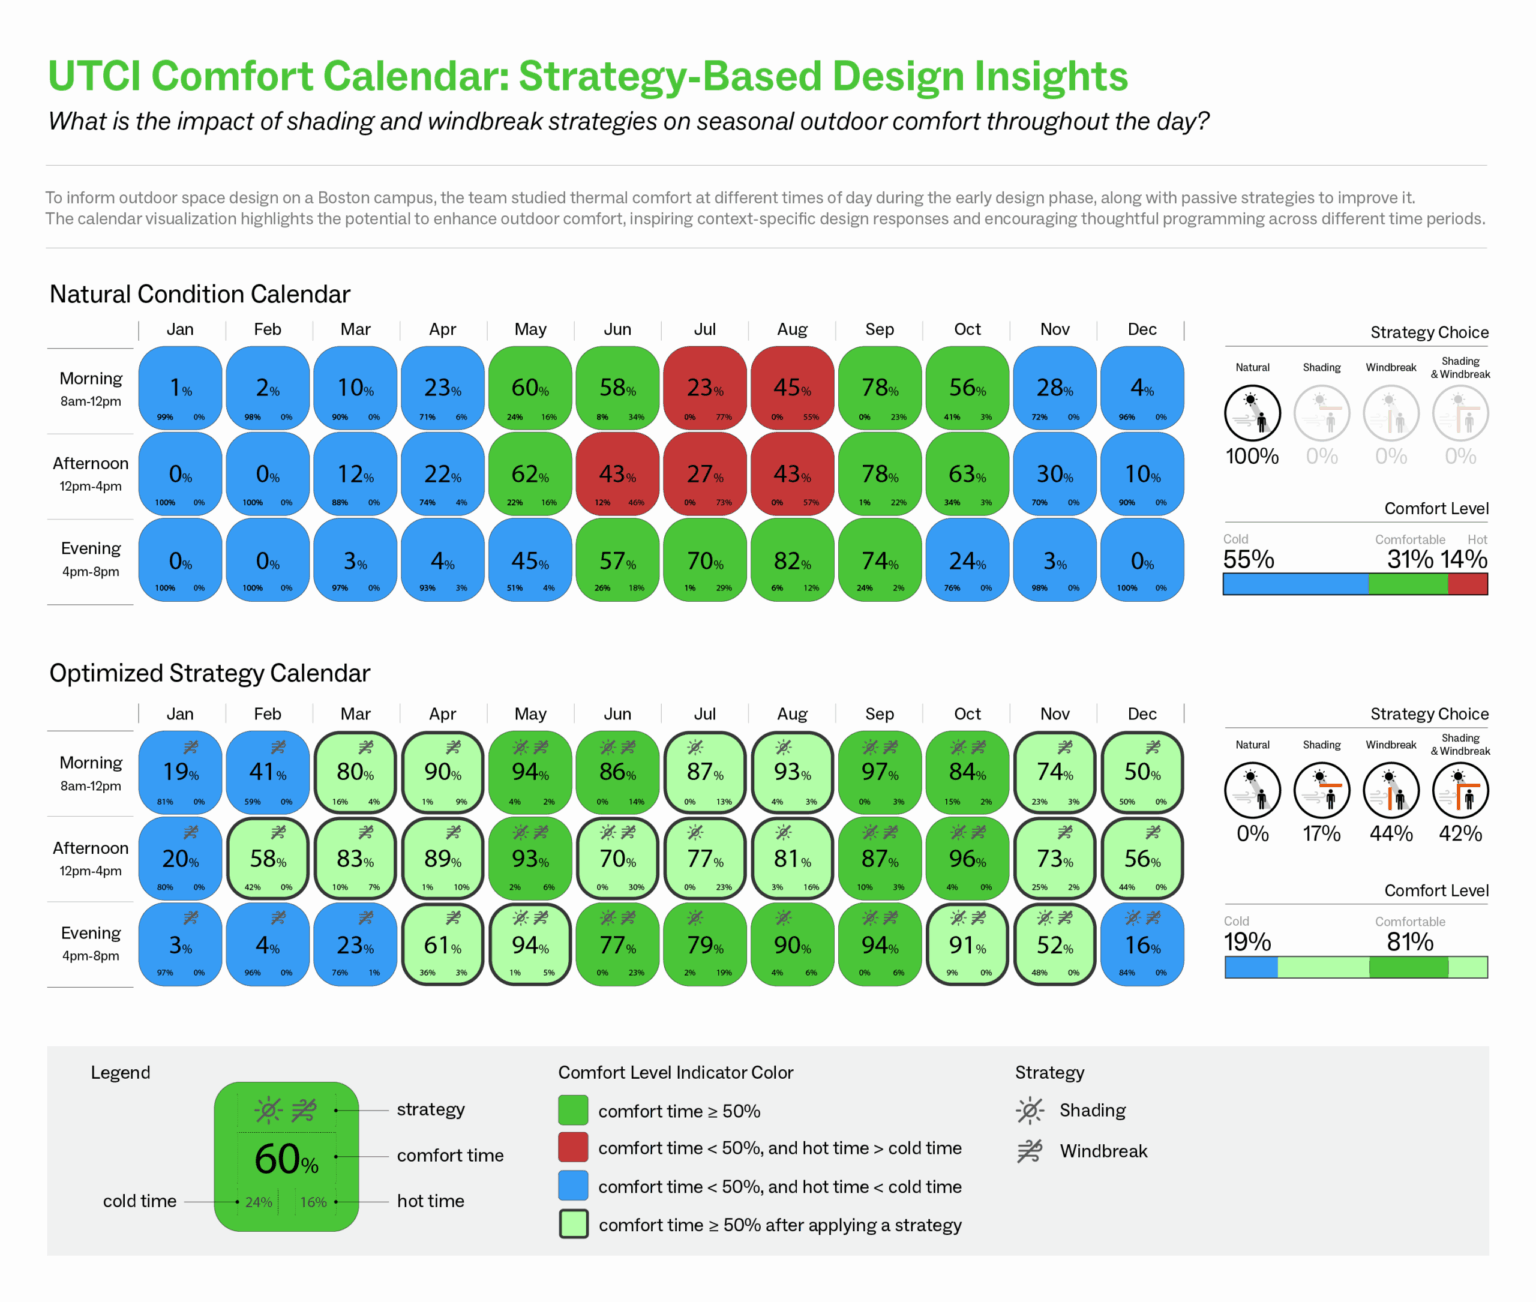
What is the impact of shading and windbreak strategies on seasonal outdoor comfort throughout the day?
Submitted By: Jiewei Li
Submission Detail: Using UTCI as the outdoor comfort metric, the first calendar illustrates thermal comfort levels across morning, afternoon, and evening periods under natural conditions. The second calendar shows the improvement after applying optimal passive strategies—shading and windbreaks—tailored to each time slot. These insights are intended to guide early-stage site design decisions for outdoor comfort.
Honorable Mention - Clarity
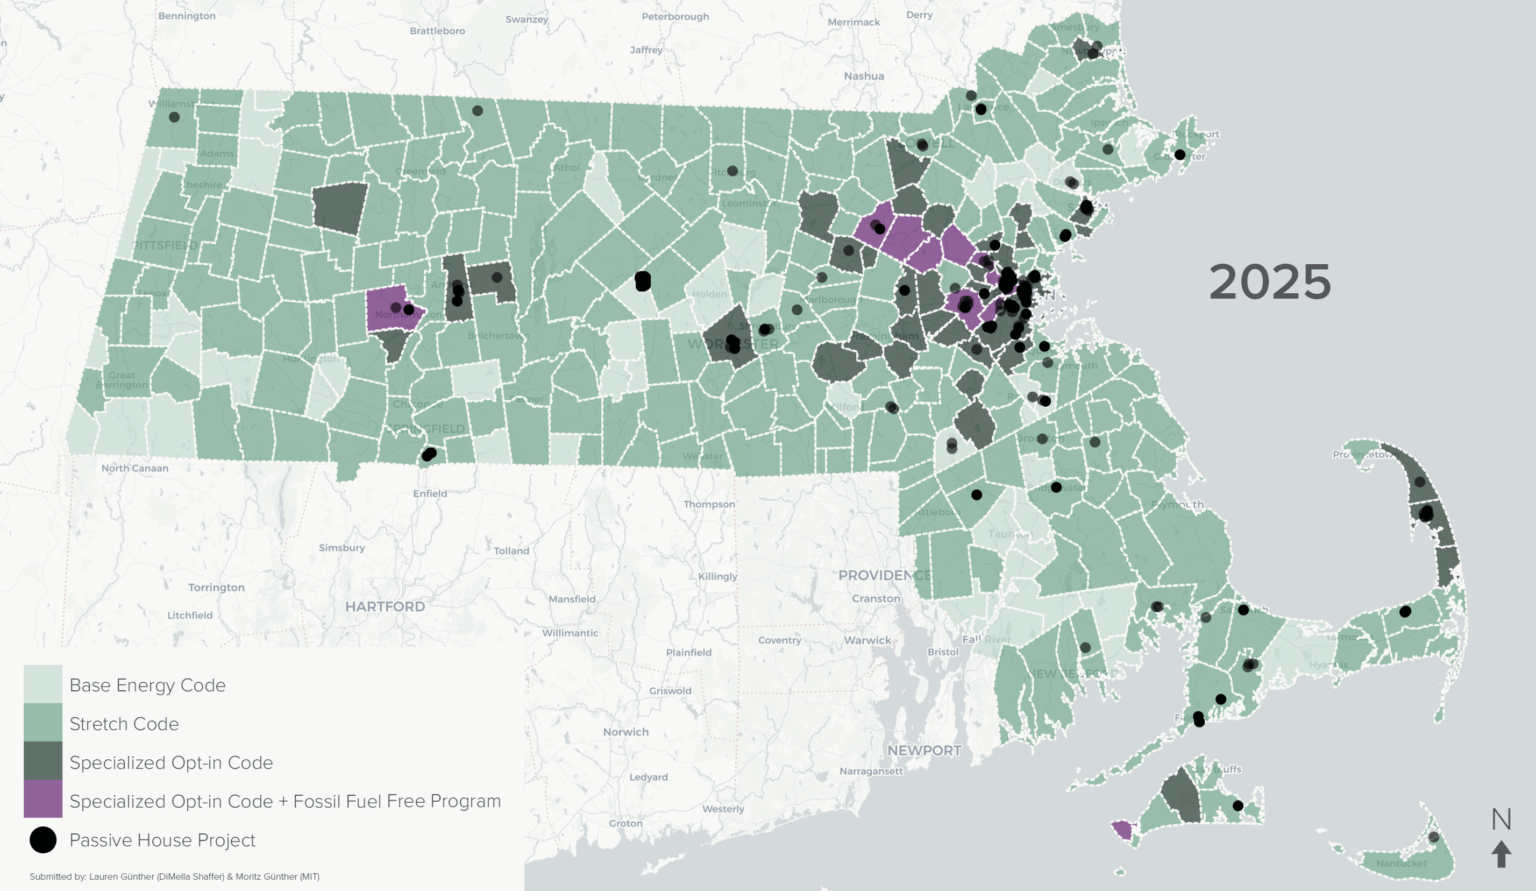
What is the impact of policy on Passive House adoption?
Submitted By:Lauren Gunther
Submission Detail:To solve big problems, we need to ask bold questions. Passive House design offers a powerful answer by delivering significant reductions in energy demand. At the end of 2022, Massachusetts enacted the Specialized Opt-in Code, which municipalities can adopt through a local voting process. This code requires Passive House certification for multi-family buildings over 12,000 sf. The map shows a clear correlation between the adoption of this more stringent energy code and a rise in Passive House projects following 2022.
Honorable Mention - Insightfulness
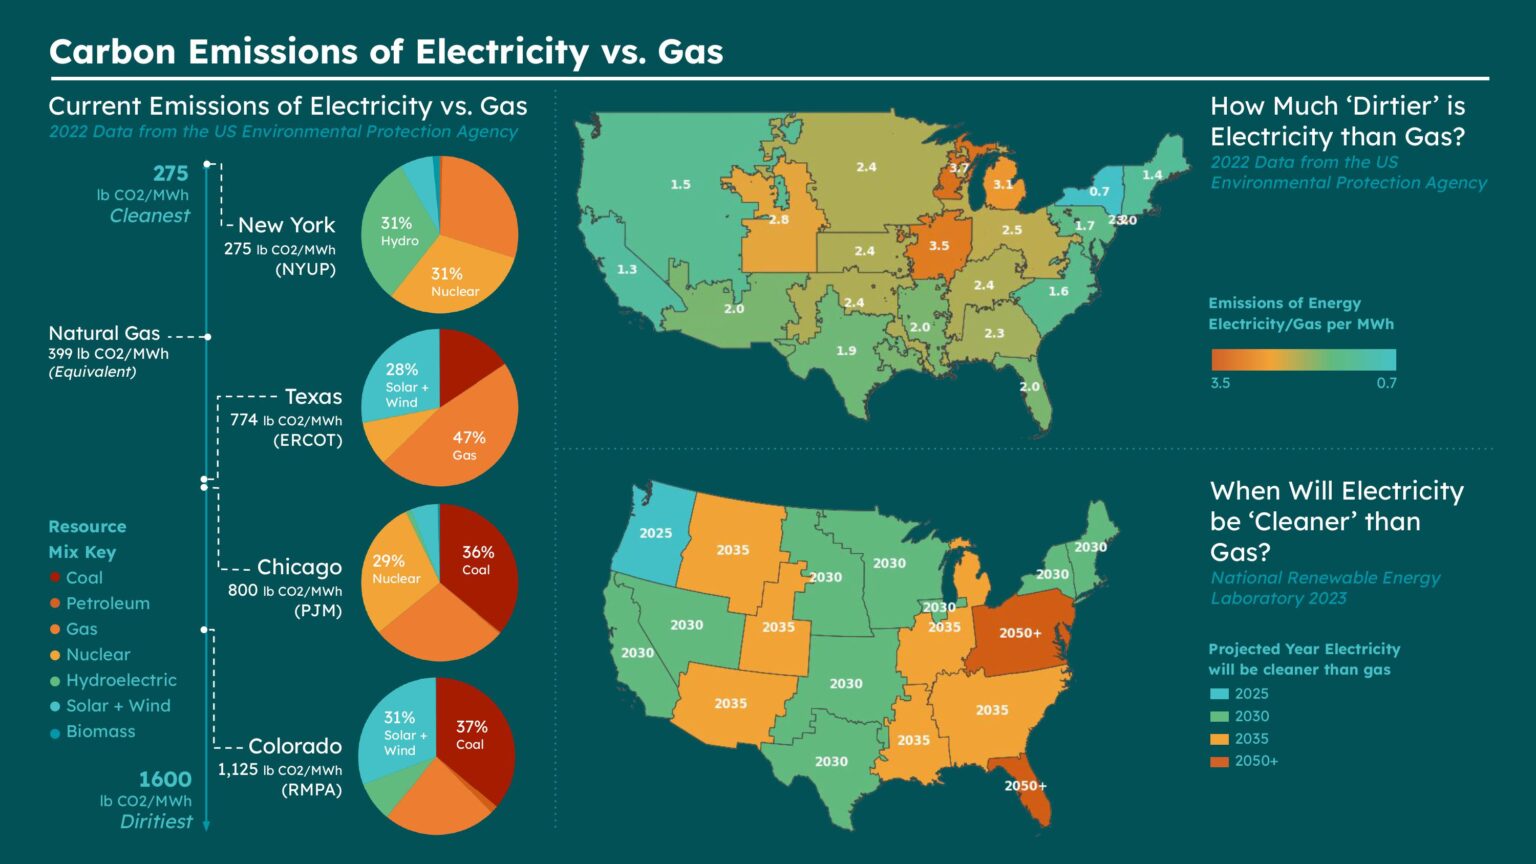
What is the impact of US location on carbon emissions of electricity versus gas?
Submitted By: Kate Bren
Submission Detail:This graphic demonstrates the relative carbon emissions of gas versus electricity in relation to electricity grid regions within contiguous US states. The graphic is split into three sections. The left most section shows the sources of electricity by city/state and how those relate to gas. The top right image shows the relative emissions of electricity versus gas. The bottom image shows the year in which electricity will emit less carbon than gas by grid region.