What is the impact of early stage design decisions on building whole life carbon?
Project Location: Zone 0A Extremely Hot Humid
Simulation Scale: Whole Building
Application: Conceptual
Audience: Architect/Designer
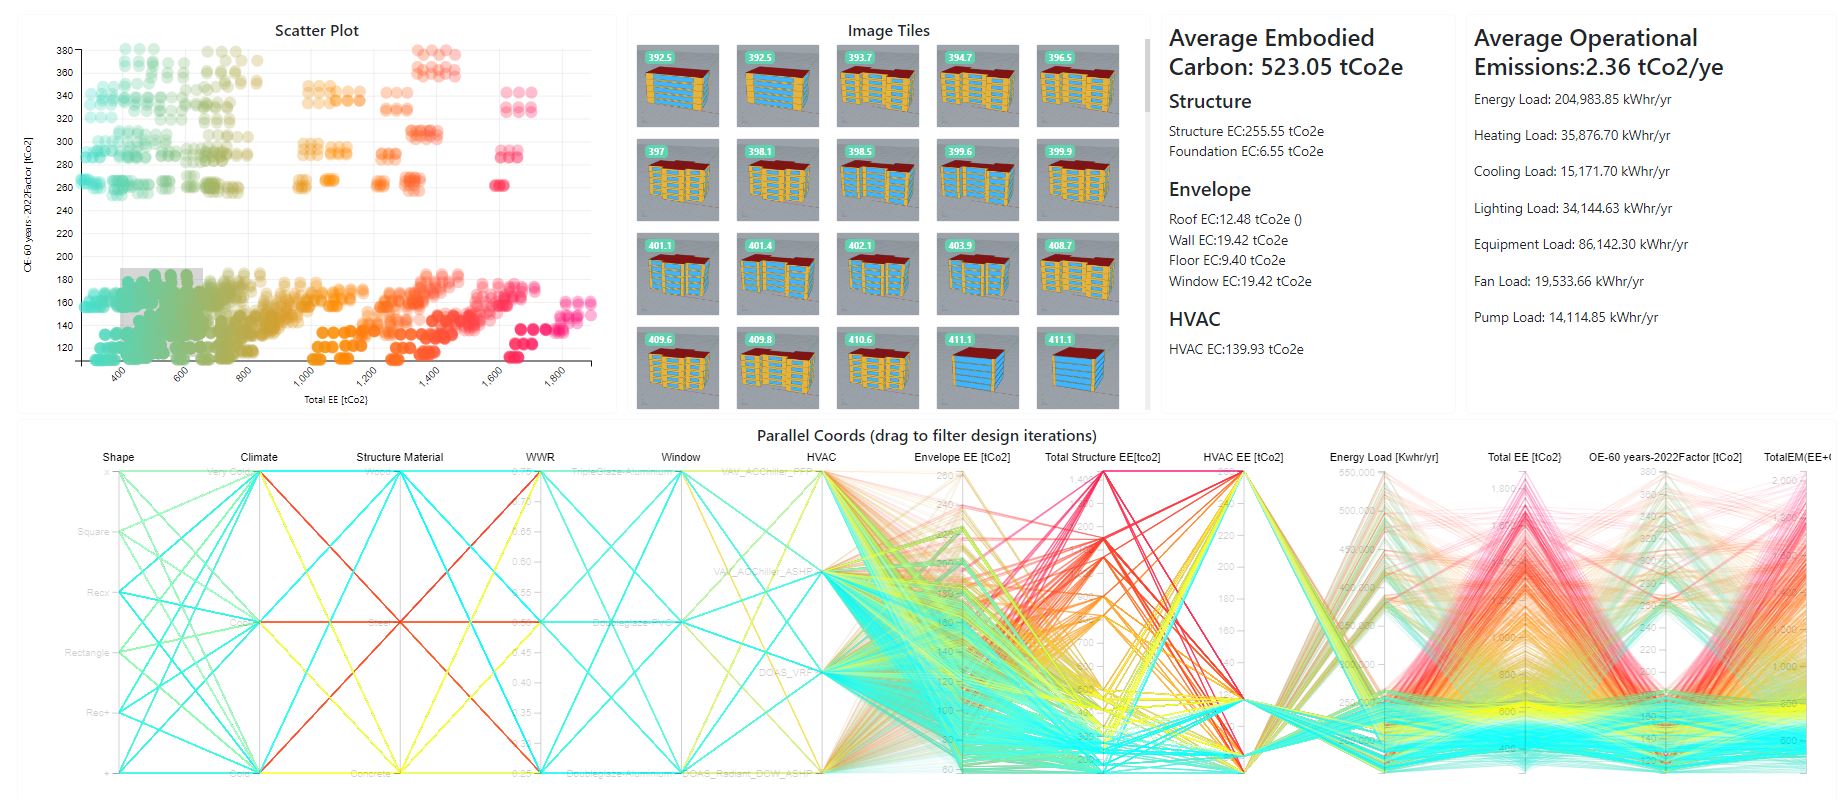
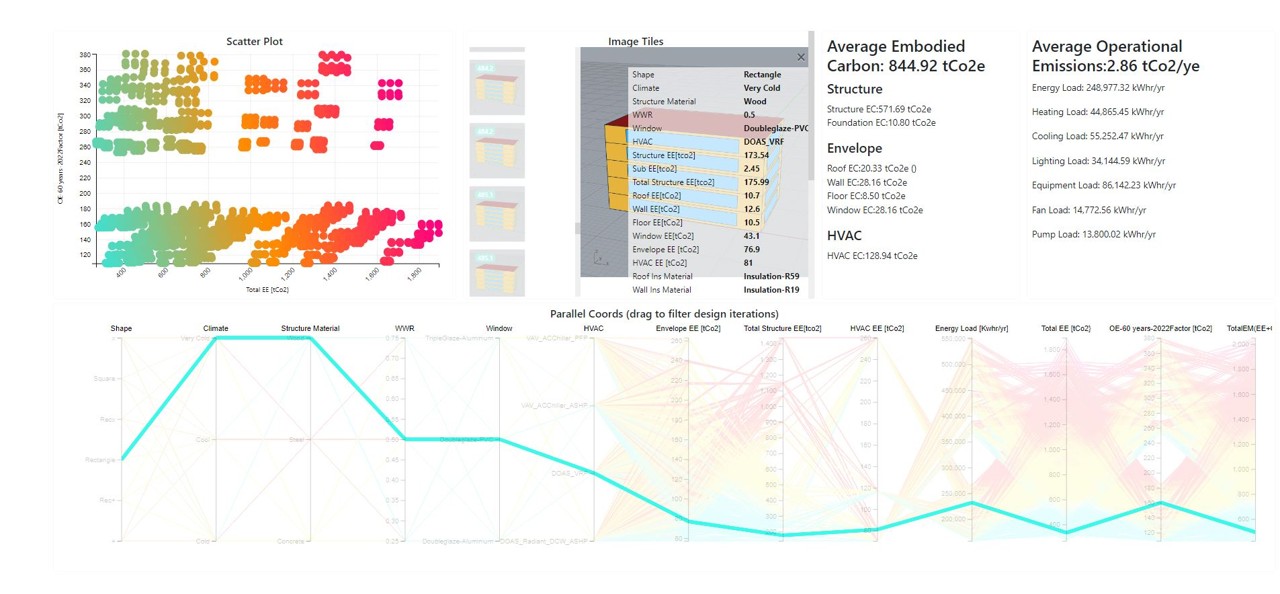
What is this graphic showing? Describe the different parts of the graphic and how it communicates the data.
This visualization tool demonstrates the results of parametric LCA modeling, allowing users to explore the total life cycle carbon of design scenarios in the early stages of design and guide the design process toward low carbon, high performing solutions. In early design phases, unknown geometry often hinders accurate material take offs, which are required inputs for most conventional building LCA tools. This tool, however, enables users to explore multiple scenarios and obtain LCA results instantly, supporting more informed decision-making during the early stage design and helping manage the high level of uncertainty. In addition to whole life carbon results, the visualization provides insights into both embodied and operational carbon and breaks down the impacts at different levels, including component level such as structure, enclosure, and MEP, as well as element level such as roof, wall, and floor, and energy loads. The tool was developed using the Thread platform by Thornton Tomasetti.
What type of graphic is this?
- Parallel coordinates
- Other
Design Variables
- Building Massing
- Building Materials
- Glass U-value / SHGC
- Glazing Fraction/Window to Wall ratio
- HVAC performance/system selection
- Insulation R-value
- Other
What tools were used for the simulation analysis?
- EnergyPlus
- Excel
- Ladybug Tools
- Other
What tools did you use to create the graphic?
- Design Explorer
What was successful and/or unique about the graphic in how it communicates information?
The graphic was successful in communicating complex LCA results derived from a large dataset in a clear and accessible way. It enables users to explore thousands of early stage design scenarios and understand their total whole life carbon through an intuitive visual interface. One unique aspect of the visualization is its ability to translate technical insights from parametric LCA modeling into a
Is there anything else you would like to mention?
No, Thank you!
Supplementary Graphics
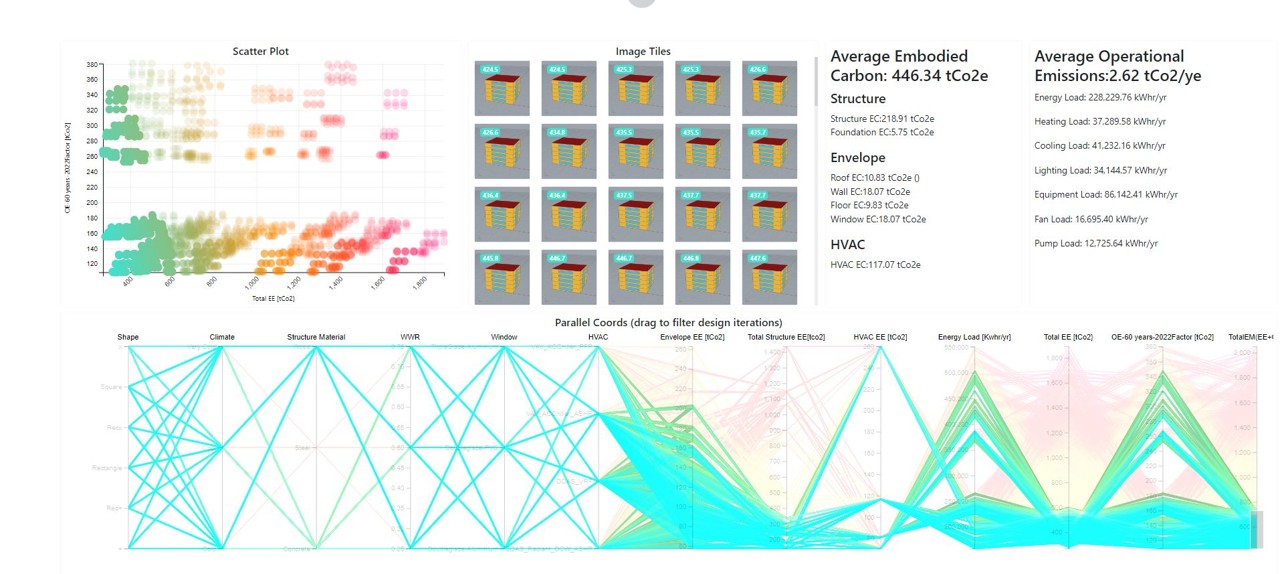
High performers: scenarios with the lowest total life cycle carbon results.
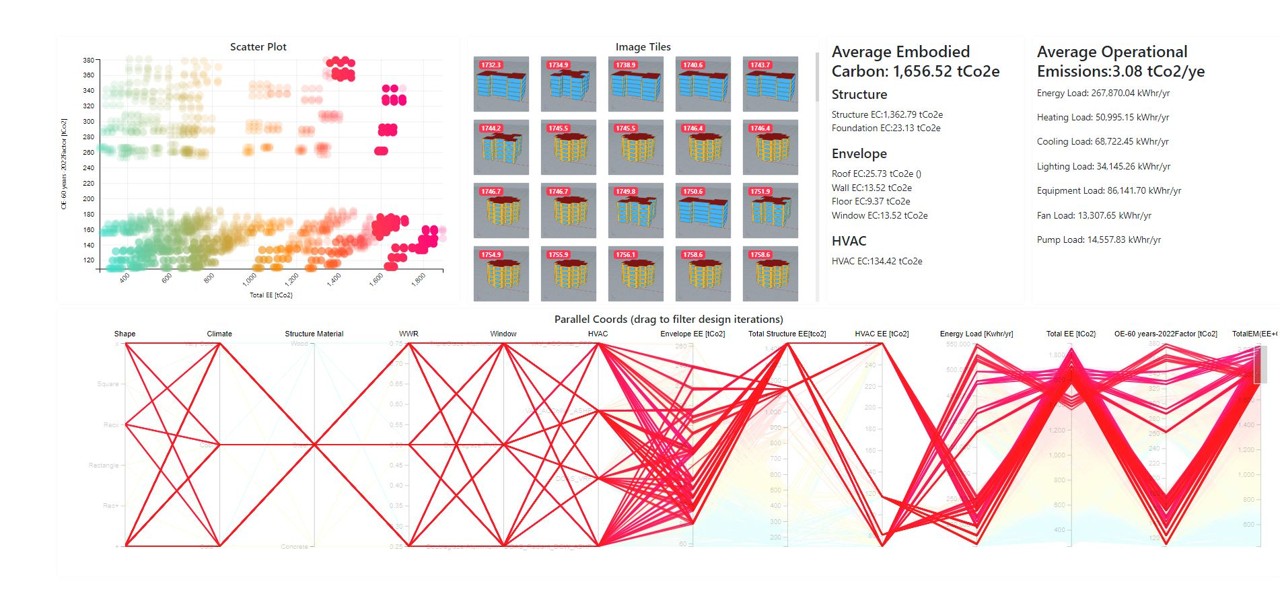
Filtering low-performing scenarios with the highest total life cycle carbon results.
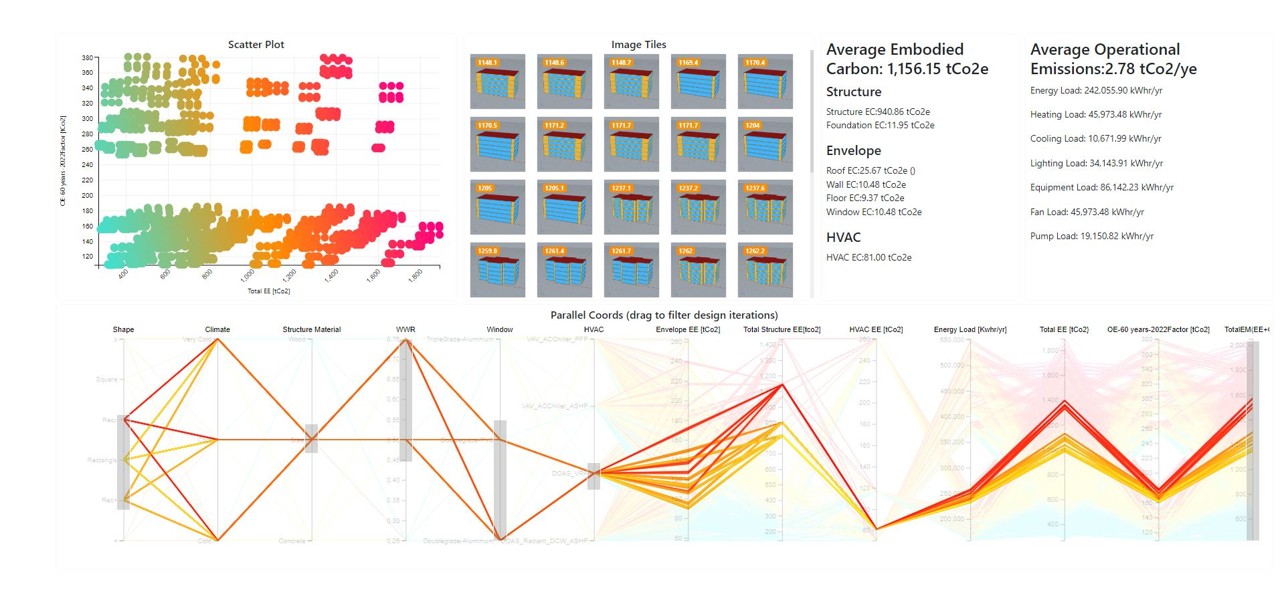
Estimation of embodied and operational carbon for a niche group of scenarios.
Instant results for a selected scenario.
Additional credits and other contributors:
Dr. Ralph Evins and Prof. Kate Simonsen for their mentorship and guidanceIncluded in the competition:

2026 Annual Project StaSIO Challenge - Deadline March 13th, 2026
November 4, 2025-March 20, 2026