What is the impact of enhancing thermal comfort on energy consumption?
Project Location: Cwa
Simulation Scale: Whole Building
Application: Research
Audience: Academic
What is this graphic showing? Describe the different parts of the graphic and how it communicates the data.
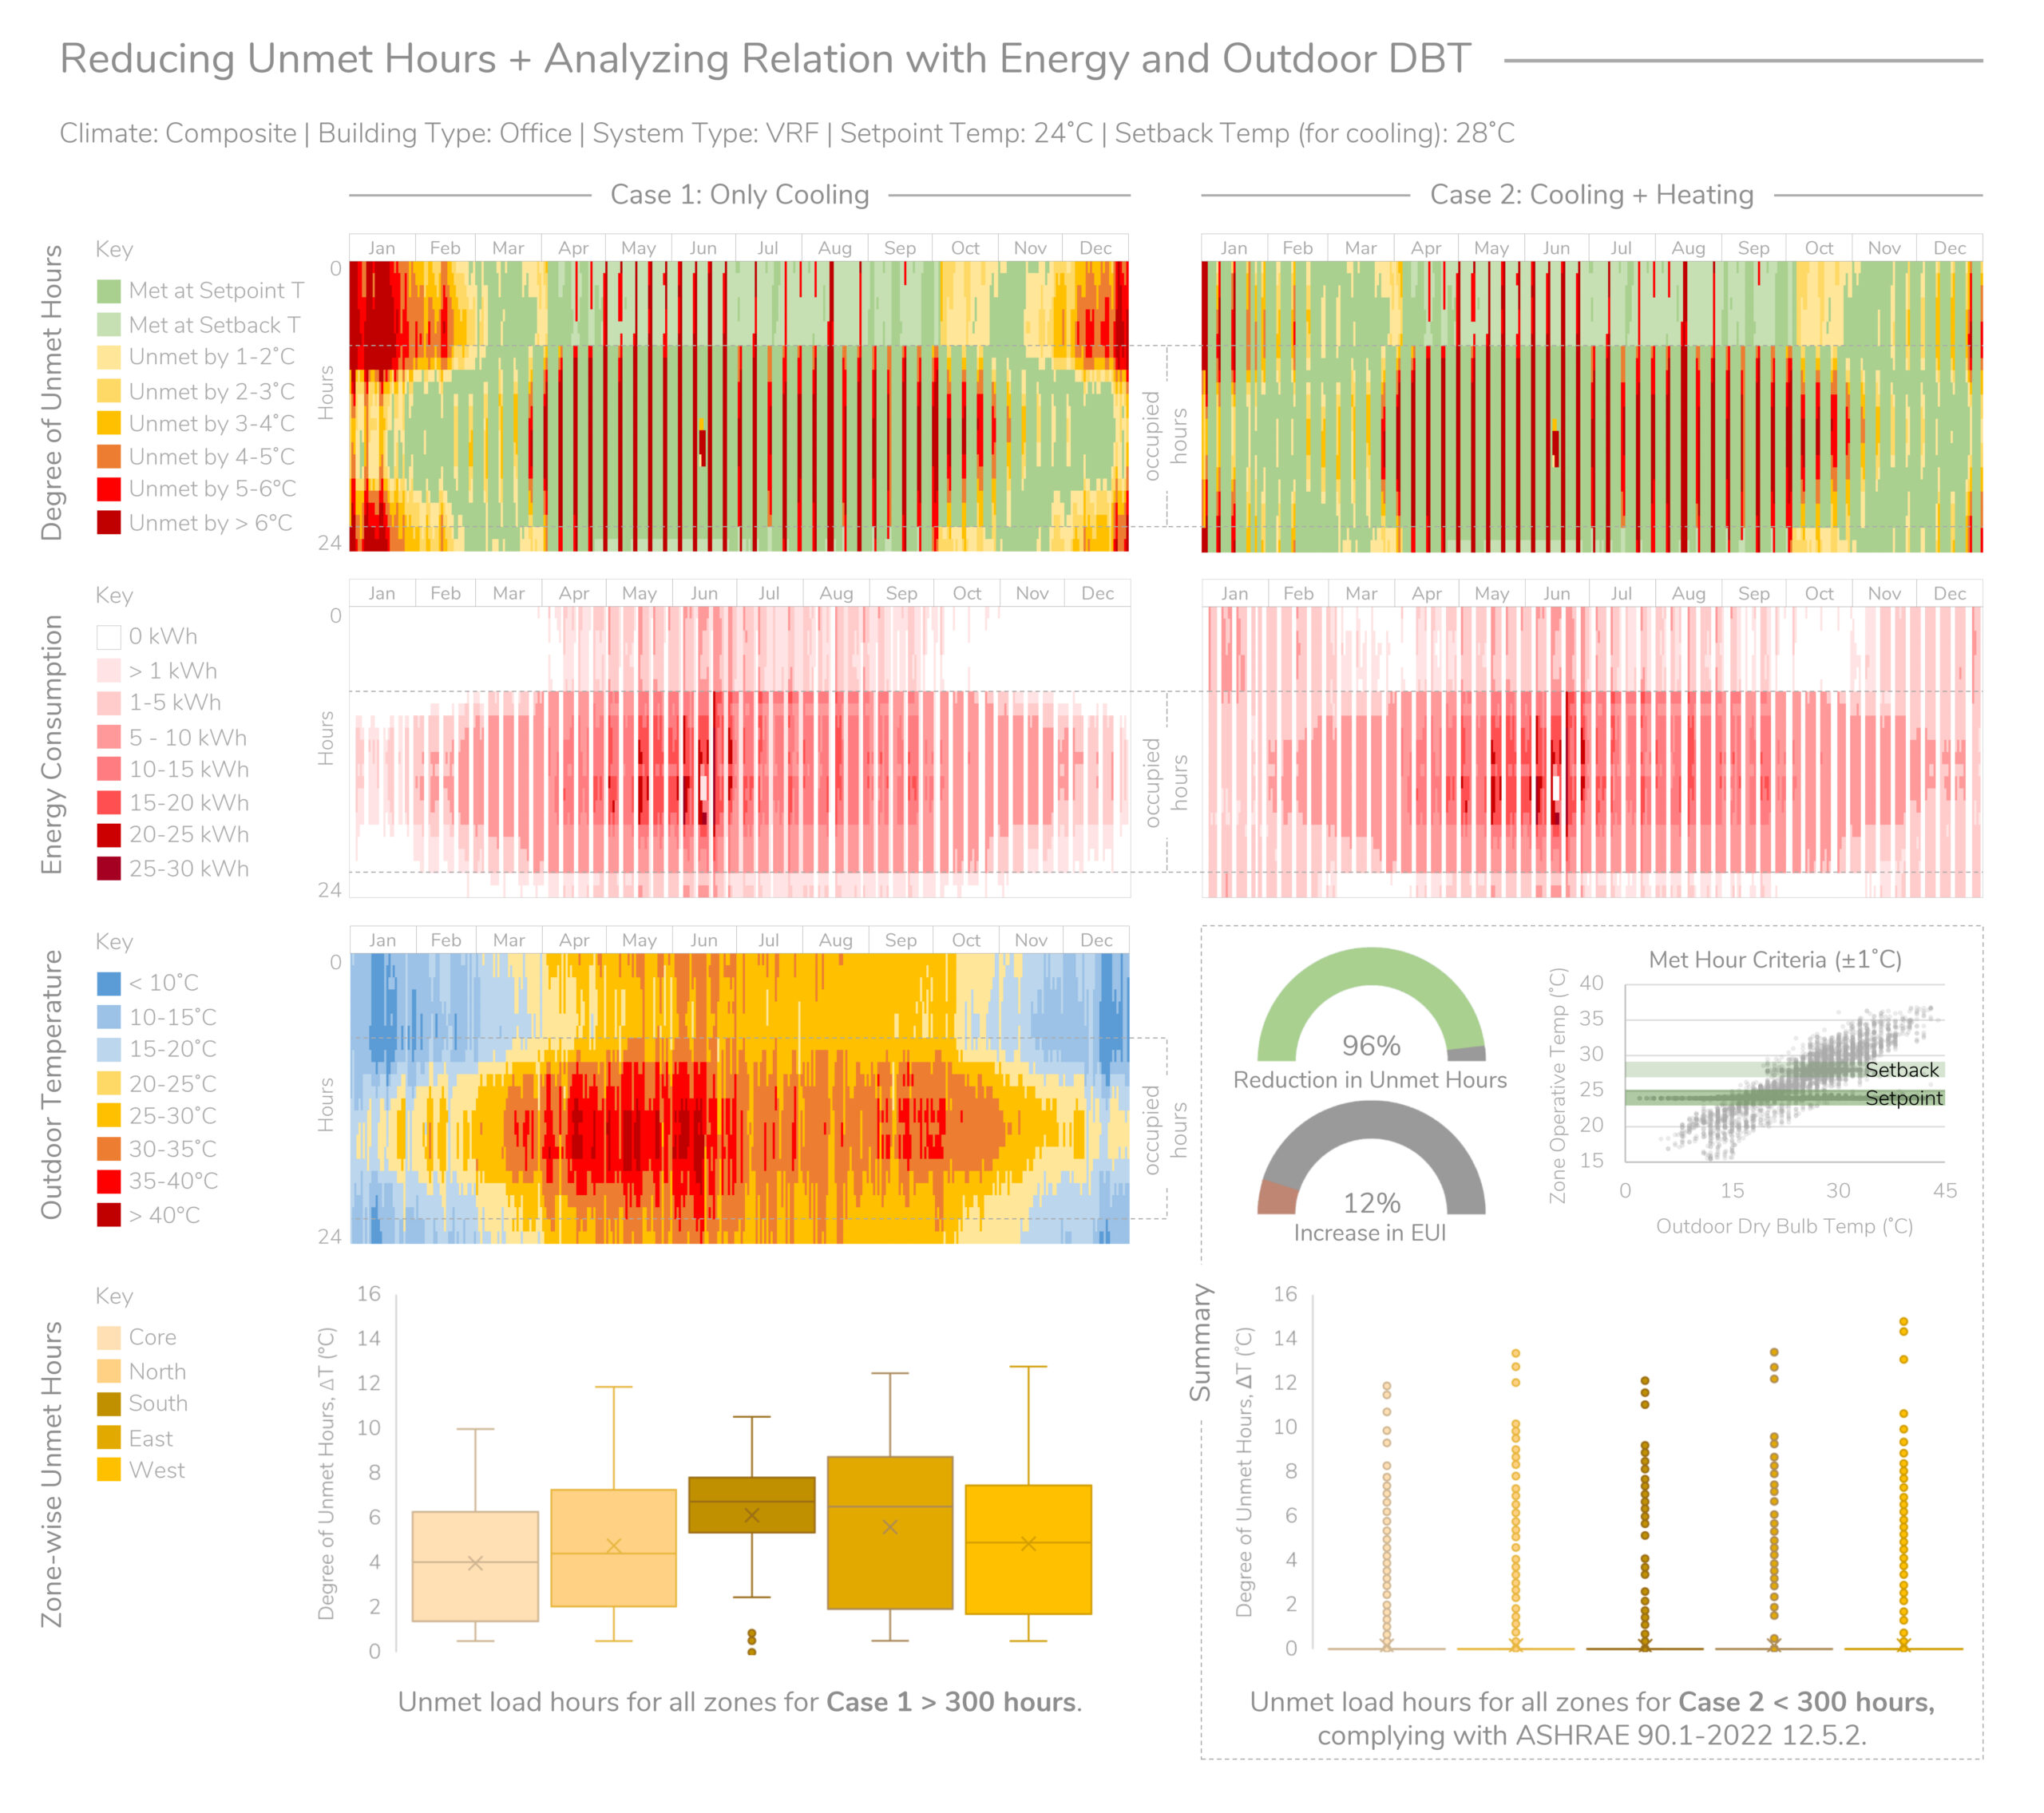
This graphic evaluates the impact of providing both cooling and heating, versus cooling alone, on thermal comfort in an office building. It illustrates simulation data of unmet hours, energy consumption, and outdoor temperature using annual hourly heatmaps. Results show that including both cooling and heating leads to a 96% reduction in unmet hours with a 12% increase in energy use intensity, along with compliance with ASHRAE 90.1-2022. This scenario offers optimal thermal comfort.
What type of graphic is this?
- Analysis grid
Design Variables
- HVAC performance/system selection
- Other
What tools were used for the simulation analysis?
- Design Builder
- EnergyPlus
- Excel
What tools did you use to create the graphic?
- Adobe Photoshop
- Excel
- PowerPoint
What was successful and/or unique about the graphic in how it communicates information?
This graphic intuitively communicates the results of thermal comfort assessment through stacked heatmaps, enabling a clear visualization of temporal patterns. Its strength lies in the use of heatmaps, which show exactly when thermal comfort issues occur and their intensity. The side-by-side comparison highlights performance differences, while a concise summary enhances comprehensiveness.
Is there anything else you would like to mention?
Included in the competition:

2025 Annual Project StaSIO Challenge - Deadline May 27th, 2025
March 20, 2025-June 5, 2025