What is the impact of EUI and area on building performance perception through scales and time?
Project Location: Zone 0A Extremely Hot Humid
Simulation Scale: Shoebox Model
Application: Conceptual
Audience: Architect/Designer
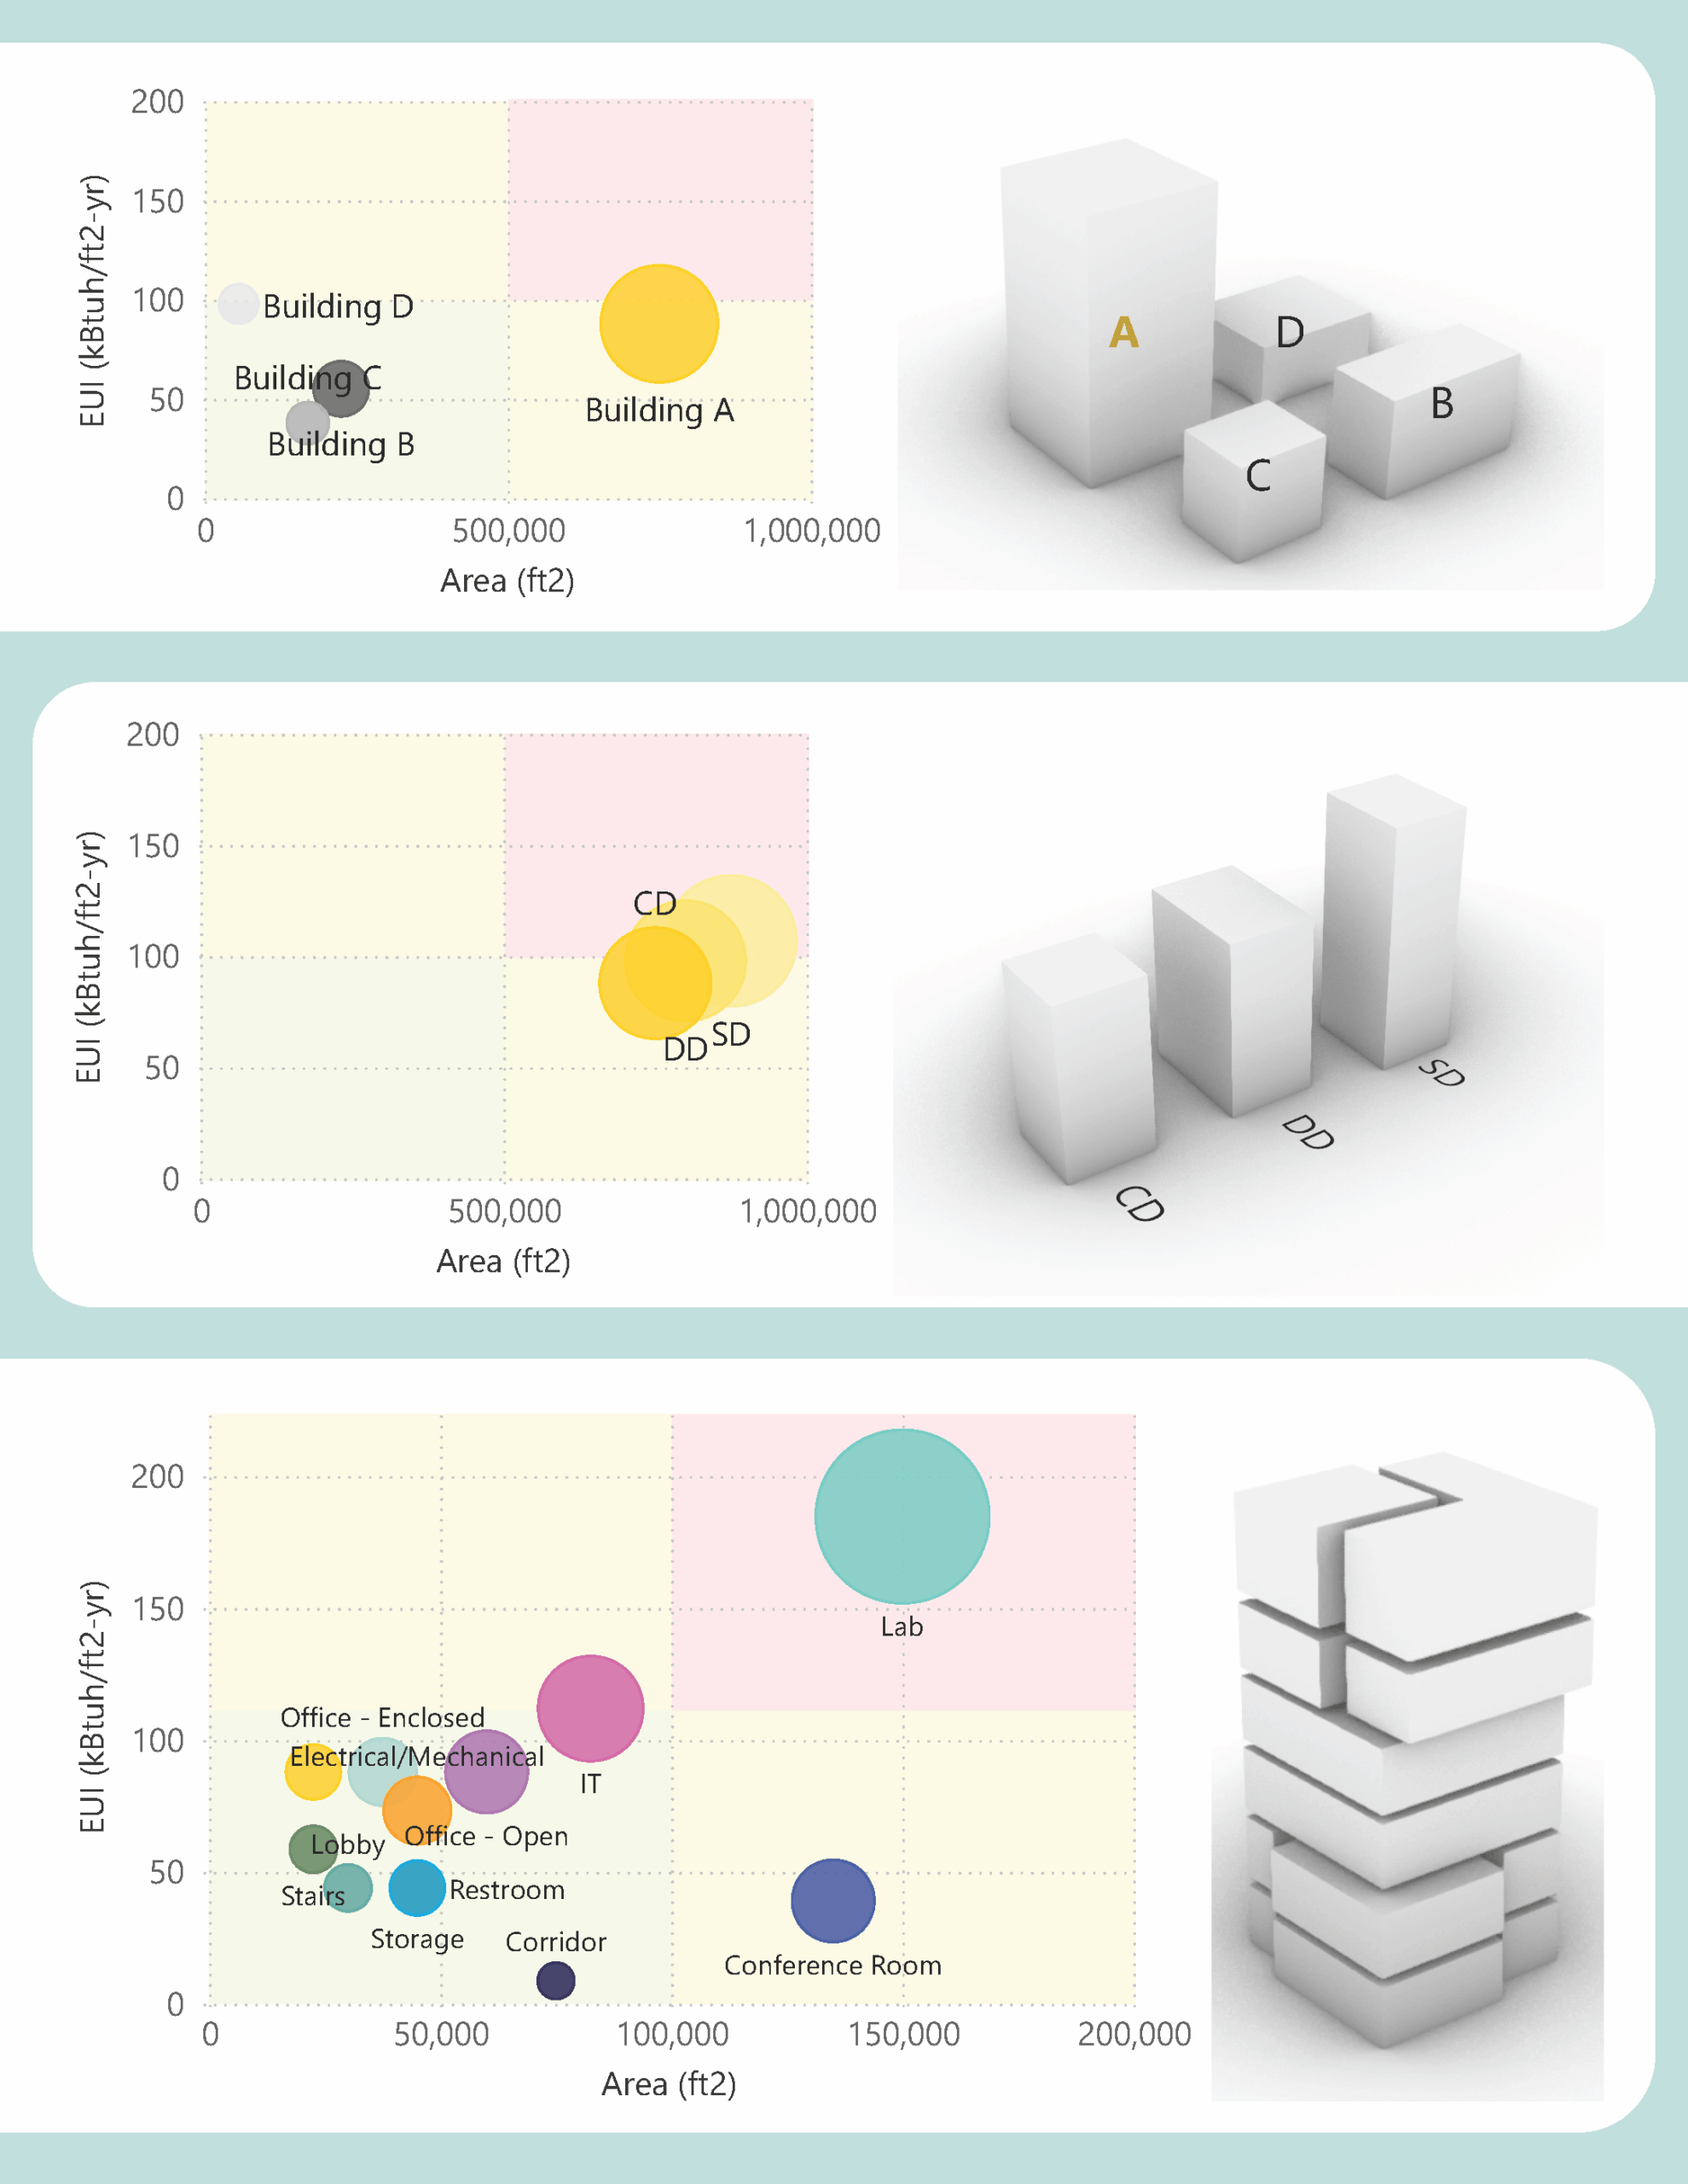
What is this graphic showing? Describe the different parts of the graphic and how it communicates the data.
Energy usage intensity, or EUI, is a widely used, but occasionally one dimensional, metric for estimating a building's performance and is calculated by dividing a building's energy consumption by its area. This graphic showcases three use cases with EUI represented through bubble charts where the floor area is the x-axis, EUI is the y-axis, and the energy consumption total related for the bubble radii. Visualizing EUI with absolute values in addition to the density metric through a multi-dimensional graphic allows end users to quickly assess a project's impact on overall energy or area. Additionally, the use cases included demonstrate how this graphic allows comparisons across portfolio scales, design phases, and building program breakdowns.
Design Variables
- Building Massing
- Other
What tools were used for the simulation analysis?
- Excel
- IES-VE
What tools did you use to create the graphic?
- Excel
- PowerBi
What was successful and/or unique about the graphic in how it communicates information?
This graphic expands upon a widely recognized metric in a multidimensional way that can be used at an inter-building, intra-building, and temporal scope. It visually quantifies absolute energy consumption in a relative diagram to contextualize the visual's subject.
Is there anything else you would like to mention?
Included in the competition:

2025 Annual Project StaSIO Challenge - Deadline May 27th, 2025
March 20, 2025-June 5, 2025