What is the impact of facade and material interventions on Residential Envelope Transmittance Value (RETV) for a high-rise residential building in a warm-humid climate?
Project Location: Aw
Simulation Scale: Floor Plate
Application: Real Project
Audience: Architect/Designer
What is this graphic showing? Describe the different parts of the graphic and how it communicates the data.
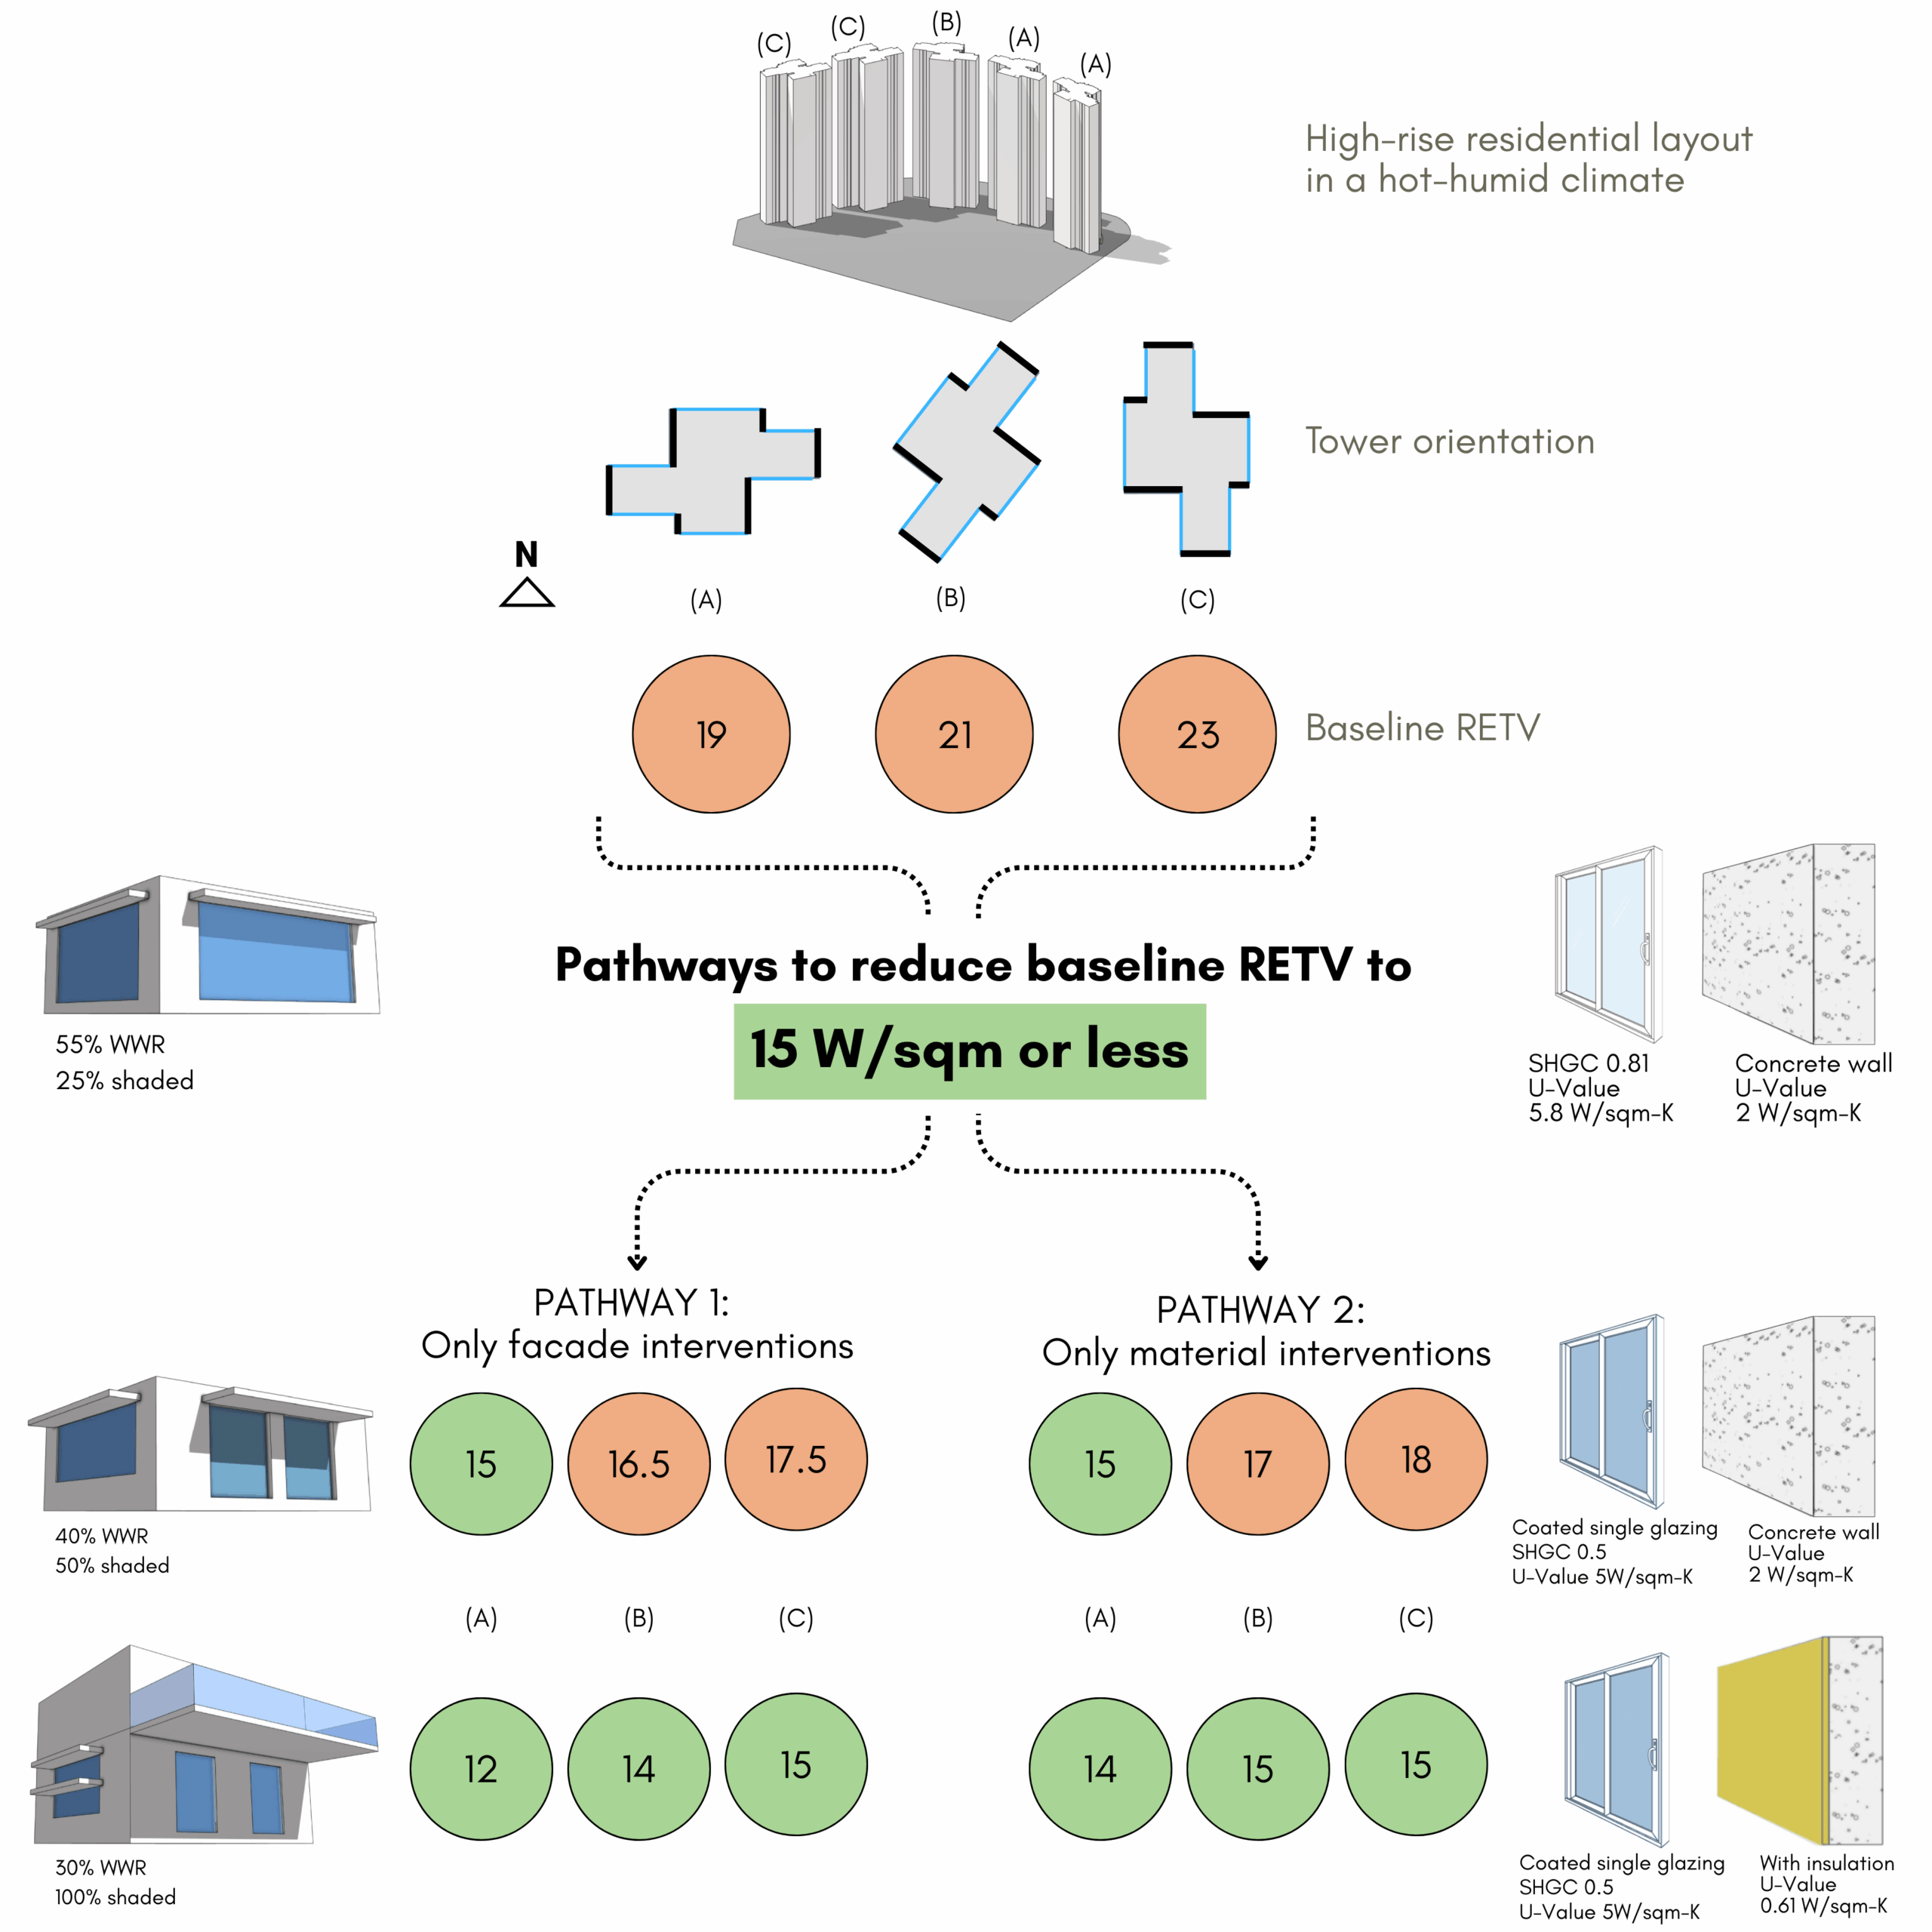
This vertically organized diagram begins with a site plan of five identical high-rise residential towers in varying orientations. Residential Envelope Transmittance Value (RETV) is calculated for three key orientations (A, B, and C) as a baseline. Two pathways to achieve the RETV target of atleast 15 W/sqm are illustrated: Pathway 1 adjusts design elements (WWR, sill height, shading depth) with the same materials, while Pathway 2 changes materials to reduce heat gain without altering the design. The graphic demonstrates that achieving low heat gain is easiest with the right orientation.
What type of graphic is this?
- Diagram
Design Variables
- Building Materials
- Glass U-value / SHGC
- Glazing Fraction/Window to Wall ratio
- Insulation R-value
- Window shading/sun control
What tools were used for the simulation analysis?
- Excel
What tools did you use to create the graphic?
- Other
What was successful and/or unique about the graphic in how it communicates information?
This graphic organizes the results such that it makes it easier for an architect to take design decisions.
Is there anything else you would like to mention?
This graphic demonstrates that simple and effective visuals can be created using accessible tools like Canva, making it easier for more team members to contribute—compared to relying on advanced tools like Illustrator and Photoshop. This approach can support more frequent and effective communication through graphics.
Additional credits and other contributors:
Sakshi AgrawalNiharika Barwal
Included in the competition:

2025 Annual Project StaSIO Challenge - Deadline May 27th, 2025
March 20, 2025-June 5, 2025