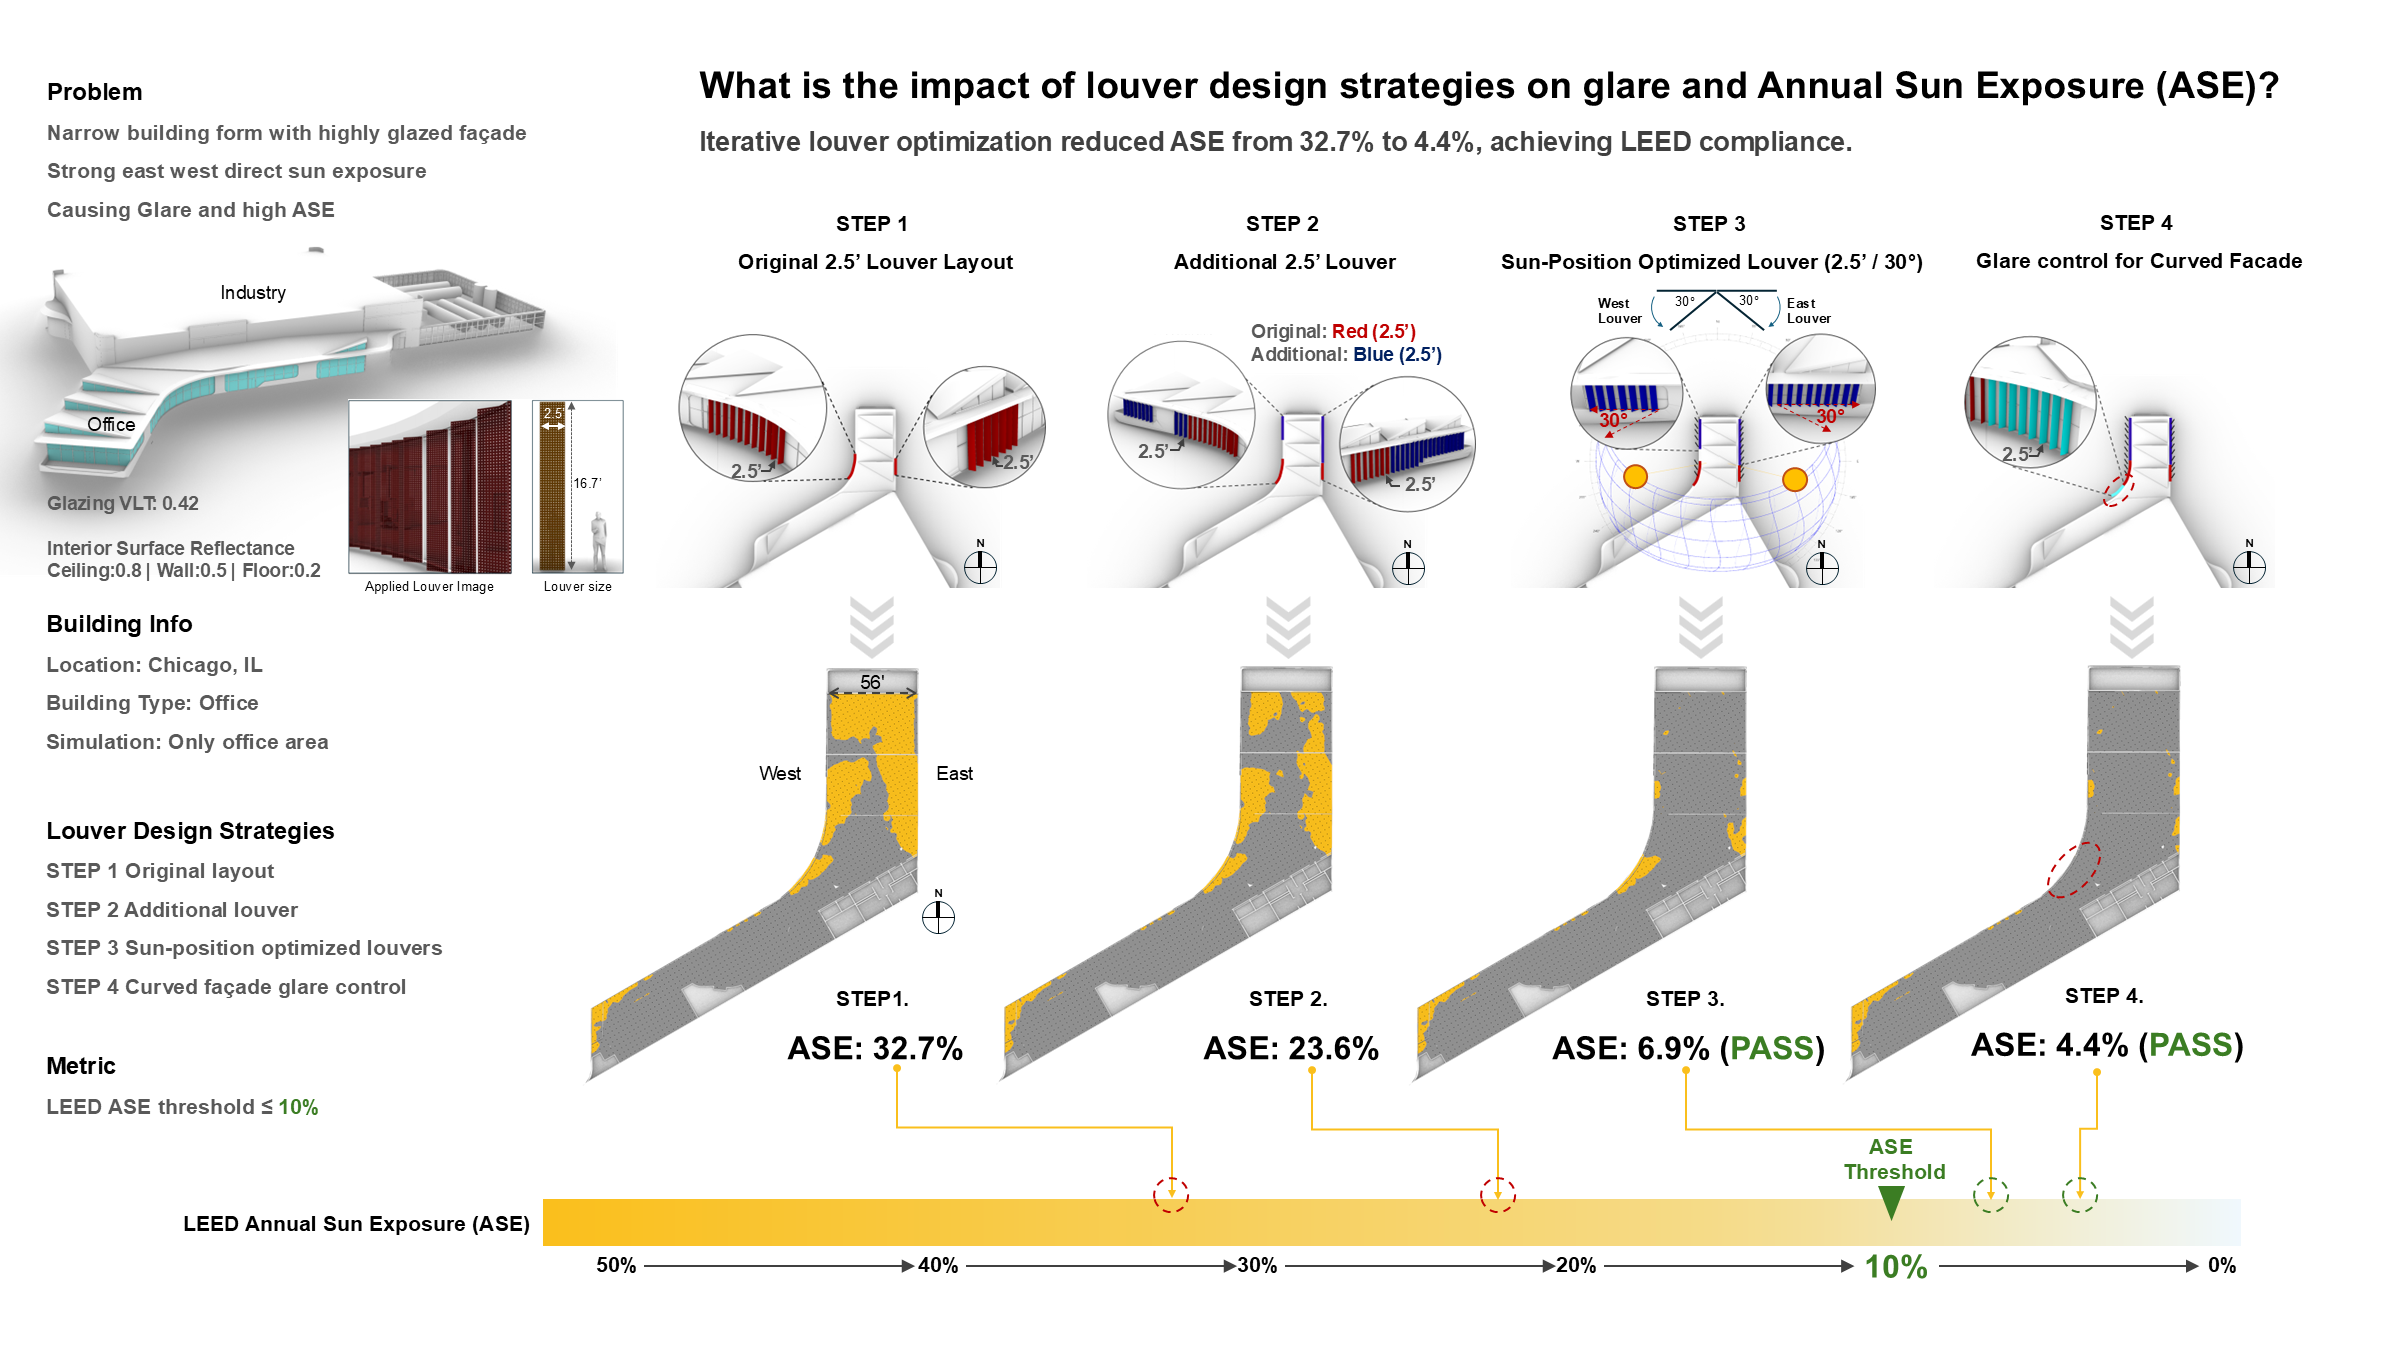
What is the impact of louver design strategies on glare and Annual Sun Exposure (ASE)?
Project Location: Zone 0A Extremely Hot Humid
Simulation Scale: Floor Plate
Application: Real Project
Audience: Architect/Designer
What is this graphic showing? Describe the different parts of the graphic and how it communicates the data.
This graphic demonstrates how facade louver strategies can mitigate glare and reduce Annual Sun Exposure (ASE) in a highly glazed office building exposed to strong east-west sunlight. Four louver design iterations are evaluated using daylight simulation. ASE is reduced from 32.7% to 4.4%, ultimately meeting the LEED ASE threshold of 10%.
What type of graphic is this?
- Analysis grid
Design Variables
- Window shading/sun control
What tools were used for the simulation analysis?
- Climate Studio
What tools did you use to create the graphic?
- PowerPoint
What was successful and/or unique about the graphic in how it communicates information?
The graphic clearly communicates the design process by organizing the louver strategies into four sequential steps, allowing viewers to easily follow how each step improves performance. The integration of 3D images with simulation results visually links louver design strategies to measurable reductions in ASE.
Is there anything else you would like to mention?