What is the impact of US location on carbon emissions of electricity versus gas?
Project Location: Zone 0A Extremely Hot Humid
Simulation Scale: Single-Aspect Analysis
Application: Research
Audience: Architect/Designer
What is this graphic showing? Describe the different parts of the graphic and how it communicates the data.
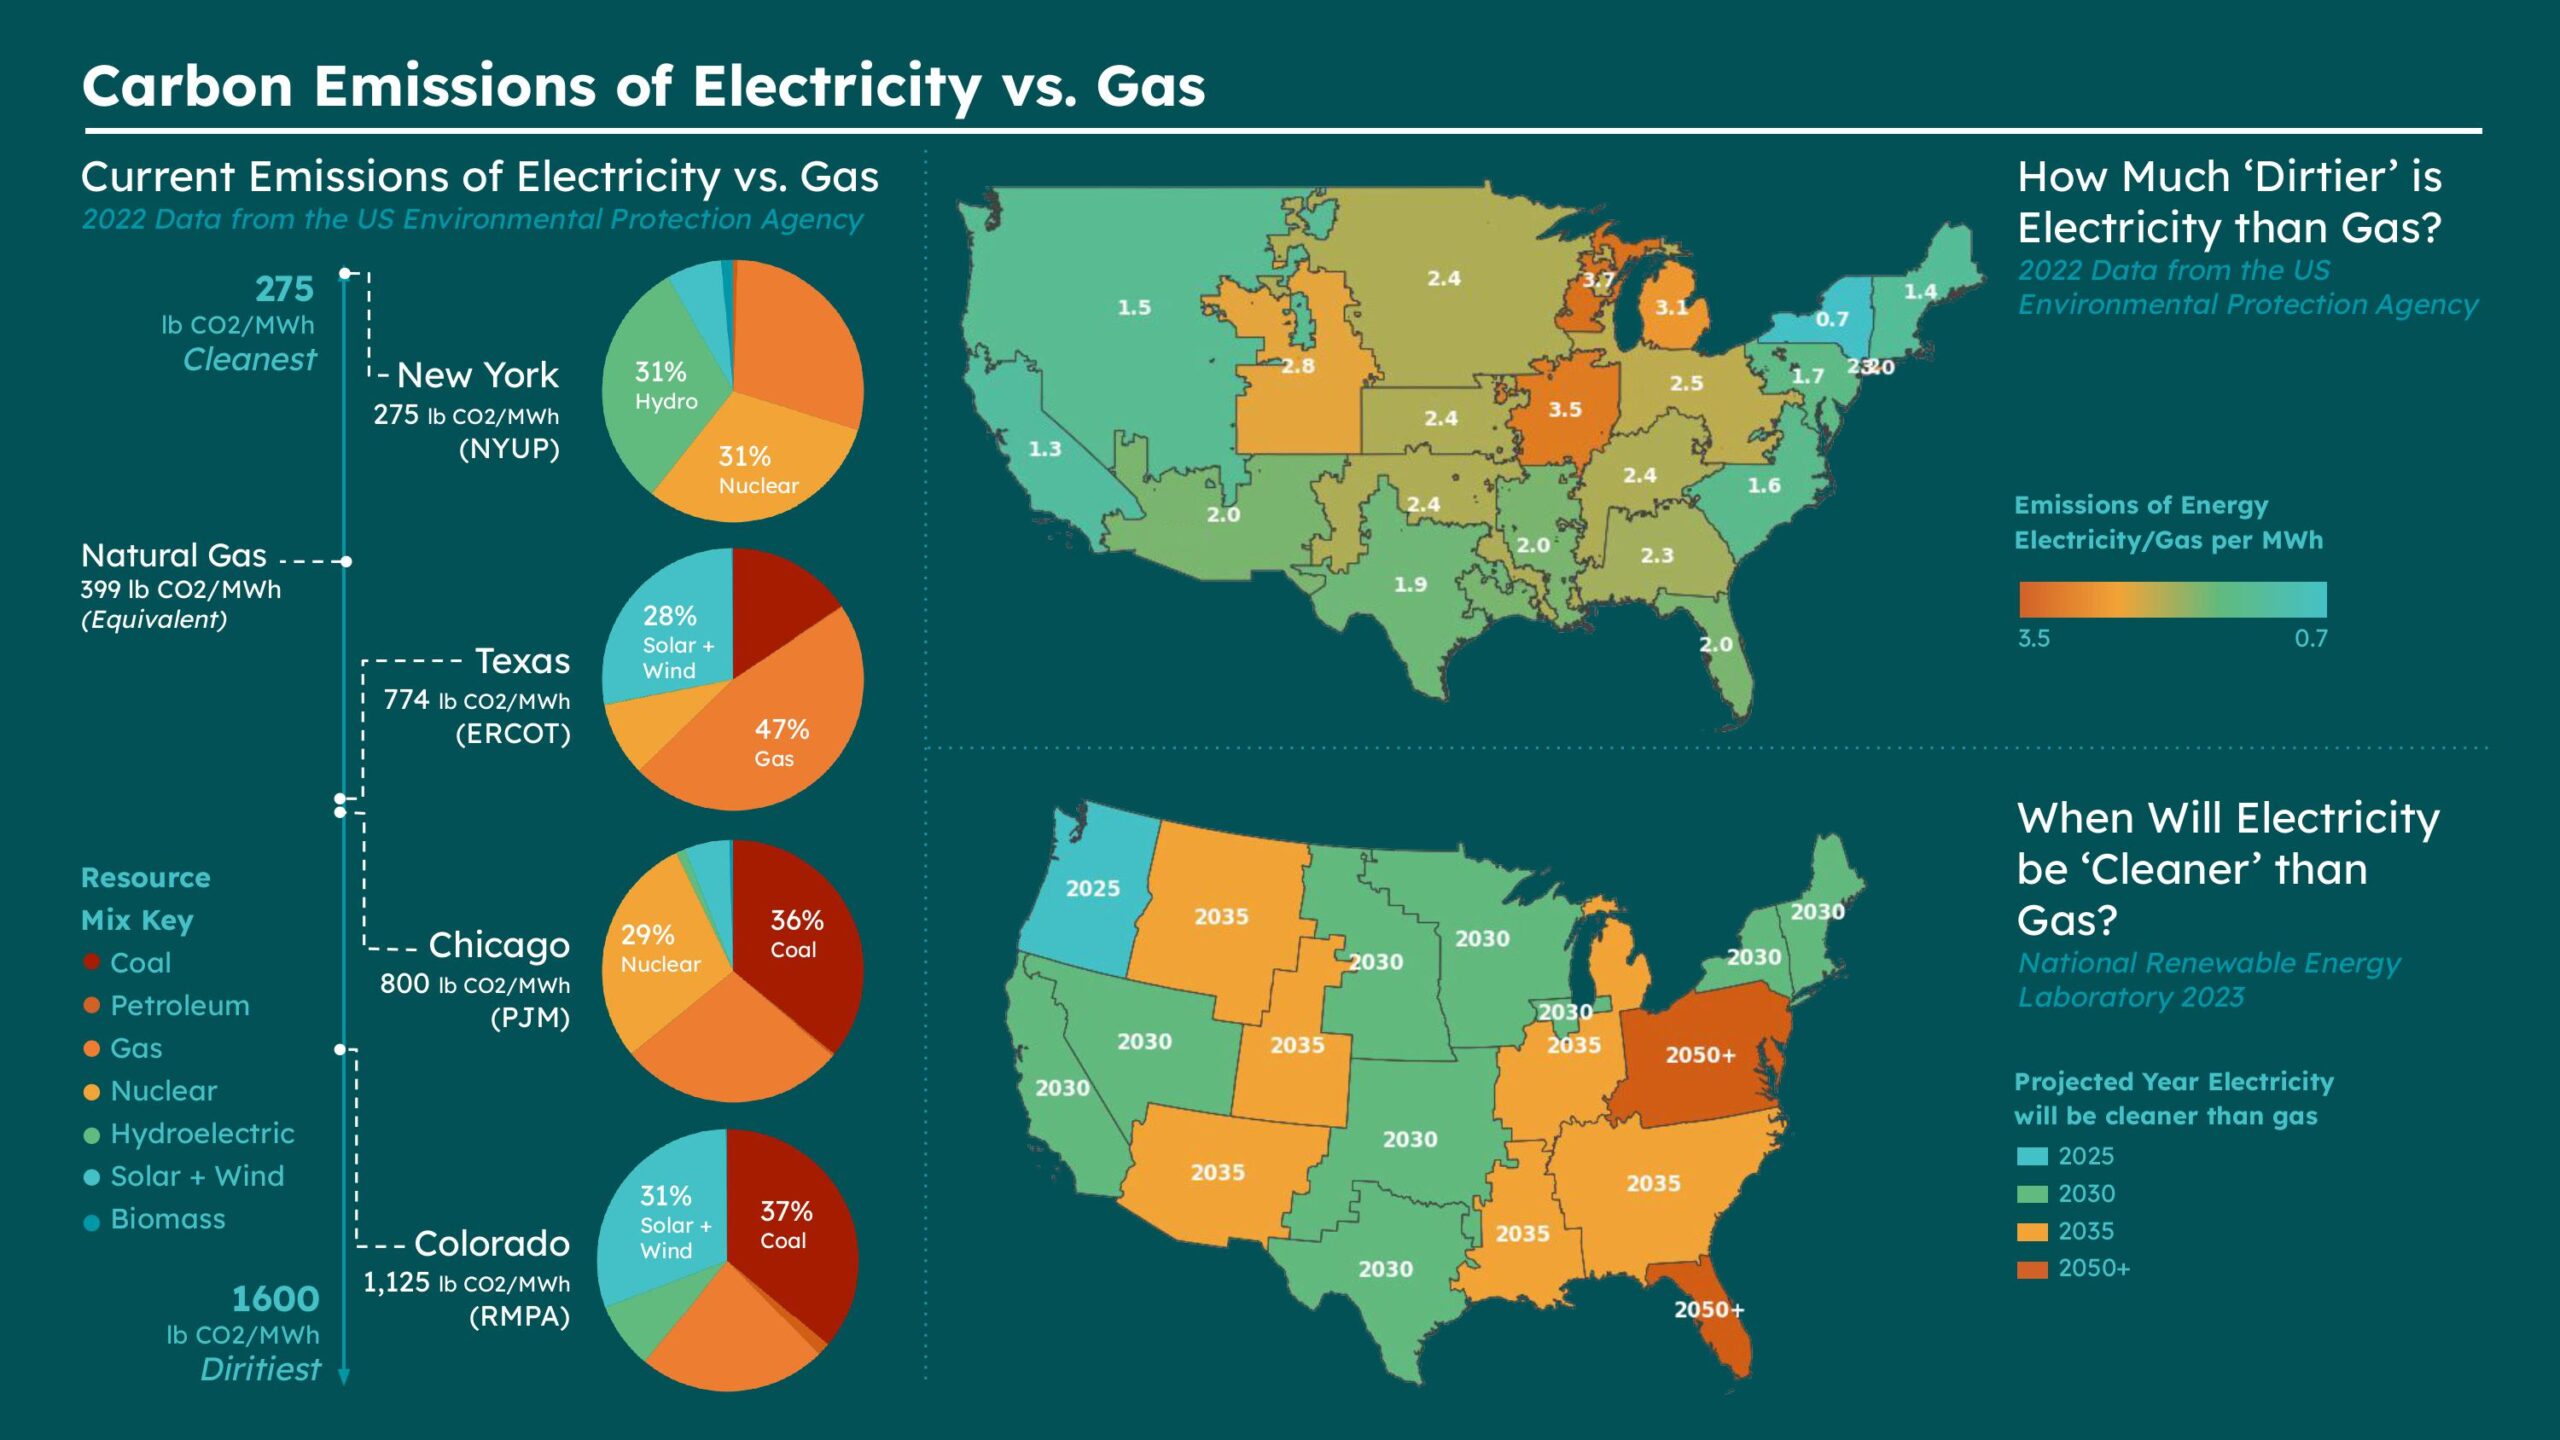
This graphic demonstrates the relative carbon emissions of gas versus electricity in relation to electricity grid regions within contiguous US states. The graphic is split into three sections. The left most section shows the sources of electricity by city/state and how those relate to gas. The top right image shows the relative emissions of electricity versus gas. The bottom image shows the year in which electricity will emit less carbon than gas by grid region.
What type of graphic is this?
- Diagram
What tools were used for the simulation analysis?
- Other
What tools did you use to create the graphic?
- Excel
- Other
- Python
What was successful and/or unique about the graphic in how it communicates information?
I feel this graphic helps communicate a complicated topic by distilling it into several components. We often think of electricity as inherently more 'green' than gas, so this graphic identifies the nuance in that statement. It invites audience members to interact by identifying their location and comparing it to others.
Is there anything else you would like to mention?
Included in the competition:

2025 Annual Project StaSIO Challenge - Deadline May 27th, 2025
March 20, 2025-June 5, 2025